How to build an AARRR funnel.
To build an AARRR funnel, define what counts as acquisition, activation, retention, revenue and referral in your business, find out how many people go through each stage and calculate the rate between one and the next. The stage with the biggest loss is where the next effort should go.
 Fabrício Martins
Founder of Martin Marketing & Design
In short
- What it is: a map of the customer journey in five stages, each with a number.
- What they are for: showing at which stage the company loses the most people and the most money.
- How to build it: one event per stage, one data source and one spreadsheet.
- What to do next: tackle one bottleneck at a time, with a test and a deadline.
What the AARRR funnel is
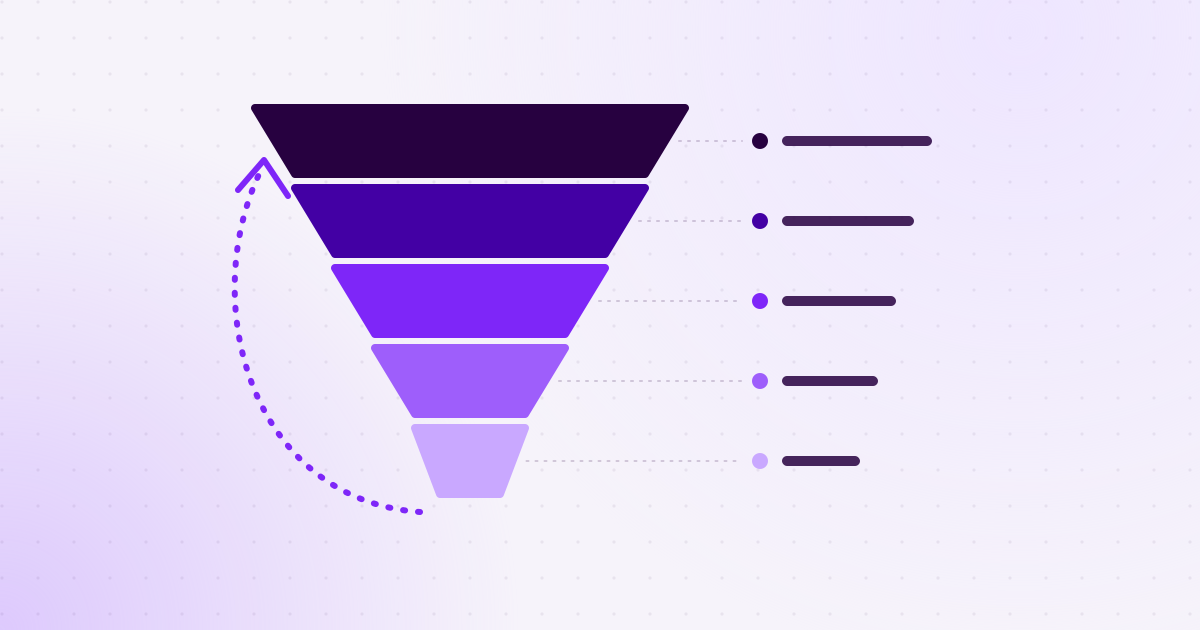
AARRR is a model that divides the customer journey into five stages: acquisition, activation, retention, revenue and referral. The name comes from the initials, which is why it is also called pirate metrics, because of how the acronym sounds.
It was presented by Dave McClure in 2007 and became the foundation of growth work. The central idea is simple: growing does not depend only on attracting more people. It depends on what happens to each person after they arrive.
If you do not know the concept of growth yet, it is worth starting with what growth marketing is. This article is the next step: how to build your company’s funnel, with numbers.
Why five stages, and not just a sales funnel
The traditional sales funnel ends at the purchase. AARRR continues after it, and that is where the difference lies.
| Sales funnel | AARRR funnel | |
|---|---|---|
| Where it ends | At the sale | At the referral |
| What it measures | Leads, proposals and closed deals | The whole journey, before and after the purchase |
| Main question | How do I sell more? | Where am I losing the most value? |
| Who uses it | Sales team | Marketing, product, customer service and sales |
A company can sell well and grow badly, if customers buy once and disappear. The sales funnel does not show that. AARRR does, because retention and referral have their own step.
Step 1: define the event for each stage
The model only works when each stage becomes a fact you can count. "Activation" is a concept. "Booked the first appointment" is an event. The table shows how the five stages translate into three types of business:
| Stage | Local service | Online store | Subscription software |
|---|---|---|---|
| Acquisition | Visited the website or the profile | Visited the store | Visited the website |
| Activation | Asked for a quote or booked | Added an item to the cart | Created the account and used the main feature |
| Retention | Came back for a second appointment | Made the second purchase | Used the product for four weeks in a row |
| Revenue | Closed the service | Completed the order | Moved to the paid plan |
| Referral | Referred another customer | Shared a coupon | Invited a colleague |
Notice that the order between retention and revenue changes with the business. In services, the sale comes before the return visit. In products with a free period, the person uses before paying. Build it in the order things happen in your company.
One event per stage. If you choose three events for each one, you will have fifteen numbers and no priority. Start with five.
Step 2: choose where to measure each event
Each stage usually lives in a different tool. Before going after numbers, write down where each one comes from:
- Acquisition: website analytics, ad dashboards and social media statistics.
- Activation: conversion events in analytics, forms and messages received.
- Retention: booking system, order history or product usage data.
- Revenue: finance or CRM.
- Referral: a "how did you hear about us" field and referral coupons or links.
It is normal for measurement to be missing in one or two stages. Referral and retention are the most forgotten. Do not wait to have everything perfect: start with what exists, even if it is a manual count, and note what needs to be installed.
The most important point is the source. Whenever possible, keep which channel each person came from, so you can later look at the funnel separated by channel.
Step 3: build the spreadsheet
With the events defined, the spreadsheet has three columns: the stage, how many people reached it and the rate relative to the previous stage. A hypothetical example, from a language school, in one month:
| Stage | Event | People | Rate |
|---|---|---|---|
| Acquisition | Visited the website | 5,000 | |
| Activation | Asked for a trial class | 200 | 4% |
| Activation | Attended the class | 120 | 60% |
| Revenue | Enrolled | 48 | 40% |
| Retention | Renewed after six months | 29 | 60% |
| Referral | Referred a new student | 6 | 20% |
Activation was split into two steps on purpose. When a stage has an important intermediate step, it is worth opening it up. Here, asking for the class and attending are different things, and the loss between one and the other is large.
Step 4: find the bottleneck
With the spreadsheet ready, the work is to find out which step deserves attention first. Three questions help:
- Where is the loss biggest? In the example, 96% of visitors leave without asking for the class, and 40% of those who ask do not show up.
- What is easiest to change? Reducing no-shows depends on a reminder and a better time slot. Doubling traffic depends on budget.
- Which improvement is worth more in the end? Run the simulation before choosing.
The simulation shows the size of each lever. If attendance goes from 60% to 75%, that will be 150 classes and 60 enrollments, keeping the same close rate. That is 12 more students per month, without a single new visitor.
To get the same 12 students with traffic alone, the school would need 1,250 more visits per month. The comparison makes clear why the bottleneck comes before the top of the funnel.
Step 5: one action per stage
Each stage has its own levers. This list serves as a starting point for hypotheses:
| Stage | If the number is bad | What to test |
|---|---|---|
| Acquisition | Few people arrive, or the wrong audience arrives | New searches, a new channel, more precise targeting |
| Activation | People visit and do not take the first step | A clearer page, a short form, proof near the button |
| Revenue | There is interest, but the sale does not close | Proposal, price, response time and follow-up |
| Retention | The customer buys once and disappears | Contact after the purchase, a reminder to return, a package |
| Referral | Satisfied customers bring nobody | A referral request at the right moment, a benefit for both |
Choose one bottleneck and one test. Define beforehand the number that needs to change and the deadline. The full prioritization method is in the article about growth, in the part on ICE scoring.
Where to start: top of the funnel or retention
The acronym suggests starting with acquisition, because it is the first letter. Many growth teams argue the opposite: start with retention. This variation became known as RARRA, with retention in front.
The argument is direct. Attracting people to a business that does not retain them is filling a leaky bucket. Each new customer costs money, and they leave before returning the investment.
Start with retention if
- Customers buy once and do not come back.
- The cost to win each customer is high.
- The business depends on recurring revenue.
Start with acquisition if
- Those who buy stay and refer others.
- The problem is that few people know the company.
- The sale is one-time by nature.
When in doubt, the numbers decide. If the return rate is low, it is the priority, however tempting it is to invest in ads.
The funnel by channel
The overall funnel hides big differences between sources. The next level is to build the same spreadsheet for each main channel.
It is common to discover that one channel brings many visits and few sales, while another brings few people who buy and come back. In the overall funnel, the two blend into an average that describes neither.
A hypothetical example: social media ads generate most of the trial class requests, but with more no-shows. Google search generates fewer requests, with much higher attendance and enrollment. The budget decision changes completely when you look at the last row of the funnel, and not the first.
This reading also changes the way you calculate the cost per customer. See how in CAC, LTV and payback.
Other breakdowns worth making
After the channel, there are three more ways to split the funnel that usually reveal what the average hides:
- By service or product. One service can attract many people and retain few, while another does the opposite. The overall funnel mixes the two.
- By type of customer. Individual and company, new customer and long-standing customer. Each group gives up at a different point.
- By month of arrival. Track separately the customers who arrived in each month. If the March ones stay longer than the January ones, something that changed in March worked.
The third breakdown is the one that best shows the effect of a change. Looking only at the total, old and new customers blend together and the improvement takes months to appear. Separating by month of arrival, it shows up right in the first group that went through the change.
You do not need to make every breakdown from the start. Build the overall funnel, then by channel, and only then open up whatever the question of the moment calls for.
How to keep the funnel alive
- Update it every month. On the same day, with the same sources.
- Compare with the previous month and with the same month last year. To separate trend from seasonality.
- Note what changed. A new campaign, a new price, a holiday. Without context, the number does not explain itself.
- Keep the definitions. If the activation event changes, the history stops being comparable.
- Take it to the meeting. A funnel nobody looks at is just a spreadsheet.
After a few months, the history becomes the company’s most useful asset for deciding investment. It shows what really moved each stage.
Common mistakes
- Measuring only the top. Visits and followers are the easiest part to count and the one that explains cash the least.
- Using vague events. "Engaged" is not an event. "Asked for a quote" is.
- Changing the definition midway. And then comparing with the past.
- Tackling every stage at the same time. Nobody finds out what worked.
- Waiting for perfect measurement. An approximate funnel today is worth more than an exact one six months from now.
- Stopping at the sale. Retention and referral are where growth gets cheap.
Frequently asked questions
Acquisition, activation, retention, revenue and referral. The acronym describes the customer journey, from discovery to the moment they bring in other people.
It does. The stages exist in any business. In services, activation is usually the quote request, revenue is the closed deal, retention is the repeat hire and referral is the customer who recommends you. Just translate each stage into an event the company can count.
No. Start with the ones you can already count, usually acquisition, activation and revenue. Meanwhile, set up measurement for the other two. The important thing is not to leave retention and referral out forever.
It varies, but in small and mid-sized companies activation comes up often: many visits and few leads. In recurring businesses, it is retention. Only the spreadsheet with your numbers answers with confidence.
One update a month is enough for most companies. Businesses with a lot of daily volume can look every week. More than that, normal fluctuations start to look like problems.
Conclusion
Building an AARRR funnel means turning the customer journey into five numbers and looking at them every month. The value is not in the spreadsheet, but in the question it forces you to ask: where am I losing the most?
Start with one event per stage and a simple count. If you want to do this with someone who runs test cycles every month, get to know Martin’s growth marketing consulting.